

Building a CloudFront log parser for Hugo with Kiro CLI.
And some surprise outcomes!
Table of Contents
When I started creating content for the AWS Community Builder program, like many people I started with WordPress. However, it was too complex, had a lot of functionality I didn’t need, and more importantly would have needed a server running somewhere to host it.
All of that led me to looking at static web site generators fairly quickly - a great advantage of this is that you can host them in GitHub or something similar; or given I’m an AWS Community Builder, build it on AWS. And that’s what I described in my article Hosting a Static Website on AWS; just S3, CloudFront and not a server to be seen. I could even tie in a really simple pipeline that would regenerate the site as I commited my changes to a git repo (more info here).
But how do you know that this approach works - I could access the site and see the pages, but how could I see what others were doing and that it worked for them? I did setup Google Analytics, thanks to a Hugo integration, but it felt over the top, and it’s been niggling away for well over a year, that I wanted a different, more aligned solution.
Luckily, my original infrastructure as code (IaC) had configured CloudFront to generate logs, and these were being generated and stored in an S3 bucket, ready for me to come along and review. But manually trawling through log files was an intensive tasks, I’d need to download the files, read through them and work out what was going on. So I decided to create a script to try and parse the data.
What I didn’t expect when I decided to find a solution was that this setup would lead me to test a different kind of tool though; one that would both transform my workflow, let me see how my blog was being viewed, and also, surprisingly, reveal unexpected truths about what happens to a website on the public internet.
Kicking Kiro CLI’s tyres
The other driver for looking at this was that I’ve been using the Kiro IDE a lot recently, but hadn’t had a chance to try out the CLI as I’ve been curious about AI coding assistants that work directly in the terminal for a while; could they help me build something genuinely useful, or would they just generate boilerplate and abandon me when things got complex? To find out, I decided to test Kiro CLI with a practical problem: making sense of my CloudFront access logs.
The goal was simple: create a tool that could fetch, parse, and analyze the raw, gzipped log files from CloudFront that are sitting in S3. What happened next included a few surprises.
Pair programming with an AI
For someone used to working with an AI driven IDE, I found the CLI process surprisingly straightforward. Because I could authenticate myself with AWS credentials, I could access my account via the AWS CLI, try a few prompts and generate code that queried the live results that I could see.
This made troubleshooting amazingly straightforward - early on, I couldn’t get any output so I tried running a simple aws s3 ls to check that there were files in the expected location. Kiro picked up the results automatically and identified that it had been using a slightly wrong format for the names it expected, the kind of thing that can get you stuck in a hour or two debugging session, but it was solved in a matter of seconds.
Likewise, because I was writing the script in Python, I was using the boto3 library. Initially, Kiro tried using the list_objects API call, but I quickly realised that when you have 3 years worth of logs, it was struggling to get yesterday’s logs. Again, because I was running commands in the same shell as Kiro, it quickly realised it could switch to the list_objects_v2 method, which includes an option to set a starting point in the list of files returned, and because CloudFront log files include a timestamp, this could be used to filter and make the processing more focused.
This close integration into the shell continued - as I refined the functionality we were writing, I could see that the original IP address was available in the CloudFront data - that meant I should be able to use geolocation to identify where the IP was based. Initially, Kiro suggested using a lightweight approach which worked initially, but with testing, I quickly hit a rate limiter. At this point, Kiro suggested that we could use Maxmind’s as a solution, and not only did it write the code to enable this alongside the original approach, but it also updated the README explaining how to configure this.
The resulting CloudFront Log Parser is remarkably functional for an hour or two’s work. It’s a robust tool with 86% test coverage that I now use regularly. The entire development felt like pair programming with an extremely fast, knowledgeable partner who never got tired.
What the script does
The basic approach is relatively straightforward, following the flow below:
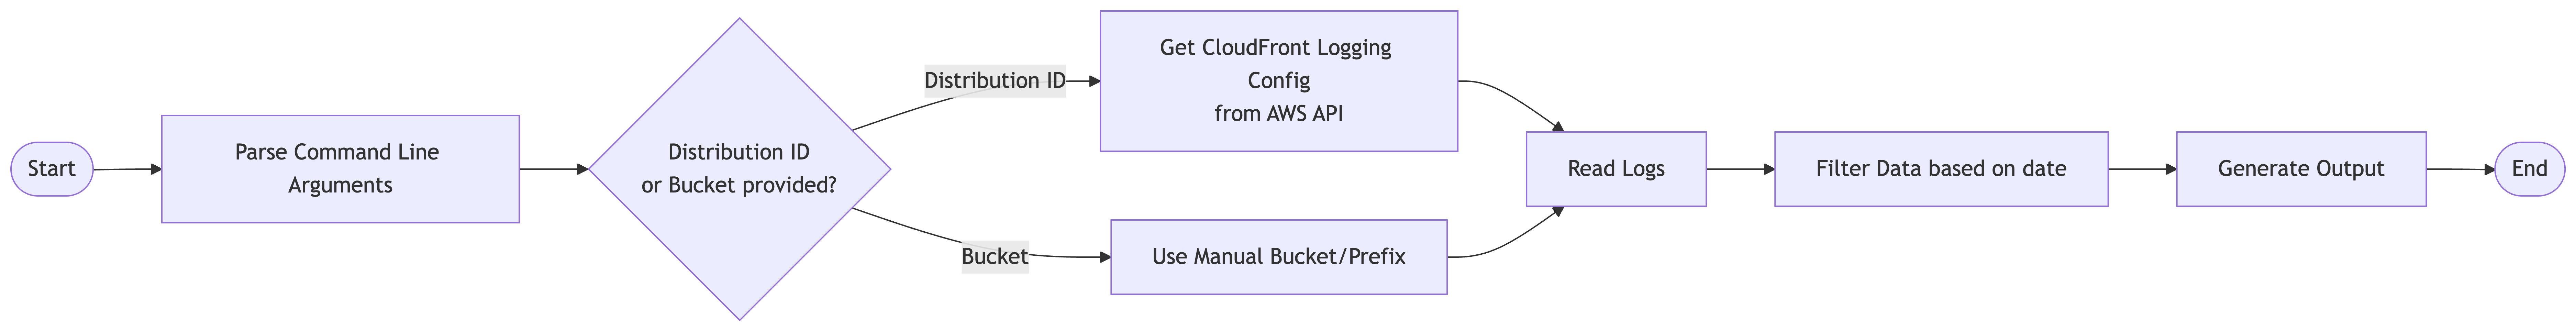
However, under the covers there’s quite a bit more detail and we end up with:
- Smart Data Retrieval: It automatically locates your log bucket (you just need your CloudFront Distribution ID) and uses S3’s StartAfter parameter to skip months of old logs instantly, focusing on the timeframe you care about.
- Human Readable Output: By default, it filters out the digital cacophony—requests for static assets (.css, .js, images), theme files, and known bot user-agents—so you can focus on actual page visits.
- Global Perspective: With optional geolocation (using either a local MaxMind GeoLite2 database or a free API), it adds country and city columns, turning IP addresses into real locations.
- Flexible Output: View data as clean, tab-separated values perfect for importing into a spreadsheet, or as fixed-width columns for quick terminal review.
Zero to Hero in a couple of hours
So, let’s look at what working with a CLI AI achieved in an hour or two.
The tool is available in a GitHub repository at https://github.com/headforthecloud/cloudfront_log_parser, and it contains a in-depth README file explaining how to install and use the tool. Once installed, it can be run by the command uv run src/scripts/read_cloudfront_logs.py -d CLOUDFRONT_ID replacing CLOUDFRONT_ID with the CloudFront Distribution ID that you want to query. This will retrieve the logs for any views today.
The default output will look something like:
2026-01-23      17:23:19        TLV55-P1        591     152.32.254.22   GET     d2q1g6fddszo0e.cloudfront.net   /app/static/js/download.js      301     http://headforthe.cloud/app/static/js/download.jsMozilla/5.0%20(Android%2014;%20Mobile;%20rv:115.2.0)%20Gecko/115.2.0%20Firefox/115.2.0   -       -       Redirect        8RKHea-uVL40fSd308VCVq0Rh4y8cyk7EP-tzWi1WwEc_C5hWOxNAQ==        headforthe.cloud http     381     0.000   -       -       -       Redirect        HTTP/1.1        -       -       53310   0.000   Redirect        text/html       167     -       -
2026-01-23      17:23:22        TLV55-P1        596     152.32.254.22   GET     d2q1g6fddszo0e.cloudfront.net   /getDownloadUrl 301     http://headforthe.cloud/getDownloadUrl%253FappType%253DAndroid  Mozilla/5.0%20(Linux;%20Android%2014;%20Redmi%20Note%209%20Pro%205G;%20Build/UD1A.231104.31)%20AppleWebKit/537.36%20(KHTML,%20like%20Gecko)%20Chrome/125.0.6422.72%20Mobile%20Safari/537.36  appType=Android   -       Redirect        Kwbhwse_anp0Z_yQ1Yt5outrHUbb9LLxDmNDnXO2Zg_u6eCWYwd3iw==        headforthe.cloud        http    476     0.000   -       -       -       RedirectHTTP/1.1        --53310   0.000   Redirect        text/html       167     -       -
2026-01-23      17:23:18        TLV55-P1        3217    152.32.254.22   GET     d2q1g6fddszo0e.cloudfront.net   /api/common/findIpAddress       404     http://headforthe.cloud/api/common/findIpAddress Mozilla/5.0%20(Android%2014;%20Mobile;%20rv:115.2.0)%20Gecko/115.2.0%20Firefox/115.2.0   -       -       Error   9_6e1X3oL0nDSFlZKKWylhGQTToPW5pCT7aGXwZktEMl7RUUZ4EJGA==        headforthe.cloud        https     330     0.163   -       TLSv1.3 TLS_AES_128_GCM_SHA256  Error   HTTP/1.1        -       -       59394   0.163   Error   text/html       -       -       -
2026-01-23      17:23:25        TLV55-P1        3219    152.32.254.22   GET     d2q1g6fddszo0e.cloudfront.net   /client/api/findConfigByKey     404     http://headforthe.cloud/client/api/findConfigByKey%253FconfigKey%253Dlevel_config Mozilla/5.0%20(Linux;%20Android%2014;%20Redmi%20Note%209%20Pro%205G;%20Build/UD1A.231104.31)%20AppleWebKit/537.36%20(KHTML,%20like%20Gecko)%20Chrome/125.0.6422.72%20Mobile%20Safari/537.36       configKey=level_config  -       Error   Yh1jUK7971iKPDcaBeURneEMZskAn_bT9zO8U7Hs1QM3K0SVLai5Uw==        headforthe.cloud        https   465     0.158   -TLSv1.3 TLS_AES_128_GCM_SHA256    Error   HTTP/1.1        -       -       59394   0.157   Error   text/html       -       -       -
2026-01-23      17:23:18        TLV55-P1        591     152.32.254.22   GET     d2q1g6fddszo0e.cloudfront.net   /mobile/film/css/index.css      301     http://headforthe.cloud/mobile/film/css/index.cssMozilla/5.0%20(Android%2014;%20Mobile;%20rv:115.2.0)%20Gecko/115.2.0%20Firefox/115.2.0   -       -       Redirect        pIb318bZGGmVZOQem5KXxDAYMoFaf2liJ7zKrmhUfH0I7c7BzPhqsQ==        headforthe.cloud http     381     0.000   -       -       -       Redirect        HTTP/1.1        -       -       53310   0.000   Redirect        text/html       167     -       -
2026-01-23      17:24:50        FRA50-P2        458     52.28.162.93    HEAD    d2q1g6fddszo0e.cloudfront.net   /       200     https://headforthe.cloud        Mozilla/5.0+(compatible;%20UptimeRobot/2.0;%20http://www.uptimerobot.com/)        -       -       RefreshHit      X9hiqVbvU6Ibn5GFtdKu093gvw9HnZV8X01n3bcoG77KKfDGuFoPdQ==        headforthe.cloud        https   348     0.062   -  TLSv1.3 TLS_AES_128_GCM_SHA256    RefreshHit      HTTP/1.1        -       -       46286   0.062   RefreshHit      text/html       -       -       -
This is the default output that shows all fields from the logs, but we can request that only certain fields be shown by using -i to show only required fields, for example uv run src/scripts/read_cloudfront_logs.py -d CLOUDFRONT_ID -i date time c-ip sc-status cs-uri-stem outputs something like:

The first surprise - where was my traffic coming from.
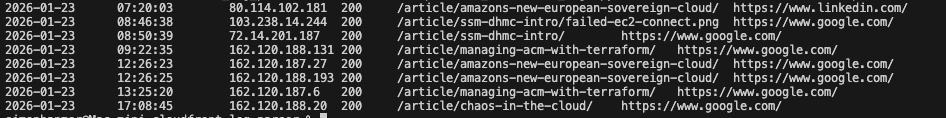
With this new tool, I was getting quick and simple visibility into who was viewing my blog. But as I reviewed the fields in the CloudFront output, I realised something. The logs include a field called cs-referer which shows what was referring traffic to my site, and with this I could see which traffic was coming from Google, LinkedIn or typing in the address directly.
Running a command like uv run src/scripts/read_cloudfront_logs.py -d CLOUDFRONT_ID -i date time c-ip sc-status cs-uri-stem shows the traffic source as below:
The Second, Darker Surprise: The Automated Battlefield
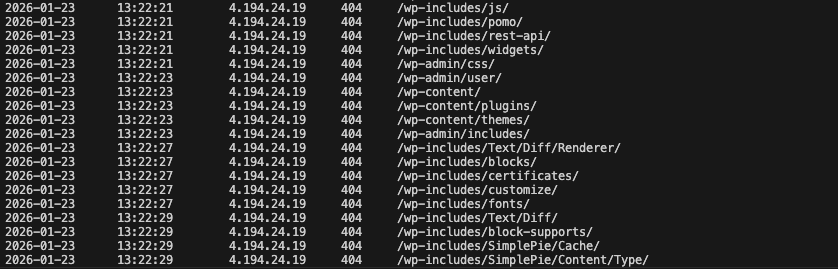
Continuing to review the output, something strange caught my eye - as I mentioned earlier, the content on my site is generated via Hugo, and contains no executable pages, but as I reviewed output I spotted that someone was trying to access php pages. Not only that, I realised that they were actually looking for WordPress admin pages, and that they were actually scanning for a variety of pages. Of course, they didn’t exist and my site was safe, but reviewing the logs over a couple of days, it was sobering to see how often I was getting scanned.
but not being used to using CLI AI tools, there was something that hadn’t dawned on me.
The Command-Line Superpower: Interactive Analysis with Kiro
One of the most powerful aspects of building a command-line tool is how seamlessly it integrates with the same environment where I’m already working. Since the log parser outputs clean, structured data, I can combine it with other command-line tools but what I hadn’t realised was how simple it would be to paste simple english prompts to Kiro CLI and it could generate results.
This meant that instead of trying to build commands manually, I simply prompted Kiro - having built the tool, and having access to the source code, it knew how the tool would work or—more interestingly—ask Kiro CLI to help me analyze the results interactively.
Here’s a really useful example:
> review todays logs and summarise any patterns or concerns

> Based on the analysis I've already completed, here's a summary of today's CloudFront traffic patterns and concerns:

## Traffic Summary (1,747 total requests)

### Geographic Distribution:
- **Hong Kong (HK): 753 requests (43%)** - MAJOR CONCERN
- **Germany (DE): 247 requests (14%)**
- **China (CN): 223 requests (13%)**
- **Singapore (SG): 179 requests (10%)**
- **Japan (JP): 87 requests (5%)**
- **United States (US): 101 requests (6%)**
- **United Kingdom (GB): 61 requests (3%)**
- **India (IN): 35 requests (2%)**
- Other countries: <2% each

### Key Concerns:

1. Bot/Scanner Activity from Hong Kong
- Single IP 152.32.254.22 made 746 requests (43% of all traffic)
- Occurred around 17:22-17:23 UTC in a concentrated burst
- Scanning for vulnerabilities: /api/, /admin, /login, /config, cryptocurrency/gambling site paths
- **Recommendation**: Block this IP and consider rate limiting

2. Suspicious Chinese Traffic
- Multiple IPs accessing unusual paths like:
  - /officialsite
  - /Alvin9999/https/fanfan1.net/daohang/
  - Various VPN-related logo/image paths
- Appears to be misconfigured bots or scanners looking for different sites

3. Other High-Volume IPs:
- 4.194.24.19 (JP): 109 requests
- 20.89.104.181 (JP): 71 requests
- 110.177.176.111 (SG): 56 requests
- These appear to be cloud/datacenter IPs, possibly legitimate crawlers or monitoring

4. Legitimate Traffic:
- AWS IP addresses accessing article images (RSS readers, social media crawlers)
- Regular visitors from Germany, UK, US accessing actual blog content
- Normal homepage and article views

### Recommendations:
1. Immediately block 152.32.254.22 (Hong Kong scanner)
2. Implement rate limiting (e.g., max 100 requests per IP per hour)
3. Consider blocking requests to non-existent paths like /api/*, /admin, /login
4. Monitor the Japanese and Singapore IPs for continued high volume
5. The Chinese traffic appears to be misdirected bots - not a direct threat but adds noise

The majority of your traffic today was malicious scanning activity rather than legitimate visitors.
or if I want to know about visitors from linkedin
> review the last two days logs and find any entries referred by linkedin

I will run the following command: uv run src/scripts/read_cloudfront_logs.py -d $CLOUDFRONT_ID -s 2026-01-21 -g ~/.geoip/GeoLite2-City.mmdb -H -i date time c-ip cs-referer cs-uri-stem country city | grep -i linkedin (using tool: shell)
Purpose: Search for LinkedIn referrers in last two days of logs

2026-01-23      07:20:03        80.114.102.181  https://www.linkedin.com/       /article/amazons-new-european-sovereign-cloud/  NL      Utrecht
 - Completed in 42.793s

> Found 1 LinkedIn referral in the last two days:

Date: 2026-01-23
Time: 07:20:03 UTC
IP: 80.114.102.181
Location: Utrecht, Netherlands
Referrer: https://www.linkedin.com/
Article: /article/amazons-new-european-sovereign-cloud/

This appears to be a legitimate visitor from the Netherlands who clicked through from LinkedIn to read your article about Amazon's European Sovereign Cloud.