Generating cloudwatch alarms using 'metric math' via CloudFormation and Terraform.
Table of Contents
I spend a lot of time working as a consultant with GlobalLogic UK&I with different client teams to deploy AWS infrastructure, and not surprisingly, I see differing levels of maturity and experience within these teams.
While we work with teams with a lot of knowledge, often they concentrate on deploying the applications and infrastructure, but they won’t think about how they can understand how well an application is working. This is an important aspect of working within the Cloud, usually termed monitoring or observability.
There are several well-known 3rd party tools, such as Splunk or DataDog, but people often forget there is a handy set of tools provided by AWS under the CloudWatch banner. CloudWatch provides a range of services, such as exposing metrics, linking them to alarms, and X-ray services, to allow us to understand the performance of services in more depth.
CloudWatch metrics
Most services that we can use within AWS, such as EC2, Lambdas, DynamoDB, etc., will emit metrics that we can use to understand how well a resource is performing.
For example, if we’re deploying EC2 instances, we can monitor many aspects of the instance, such as
- CPU utilisation,
- Disc read and write metrics,
- Network traffic.
While we’re working with lambda functions, we can monitor
- Number of invocations, including how many concurrent invocations,
- The duration of a function run,
- How many errors are generated?
- How many invocations were throttled (for example, if we exceeded the allowed number of lambda invocations in an account)?
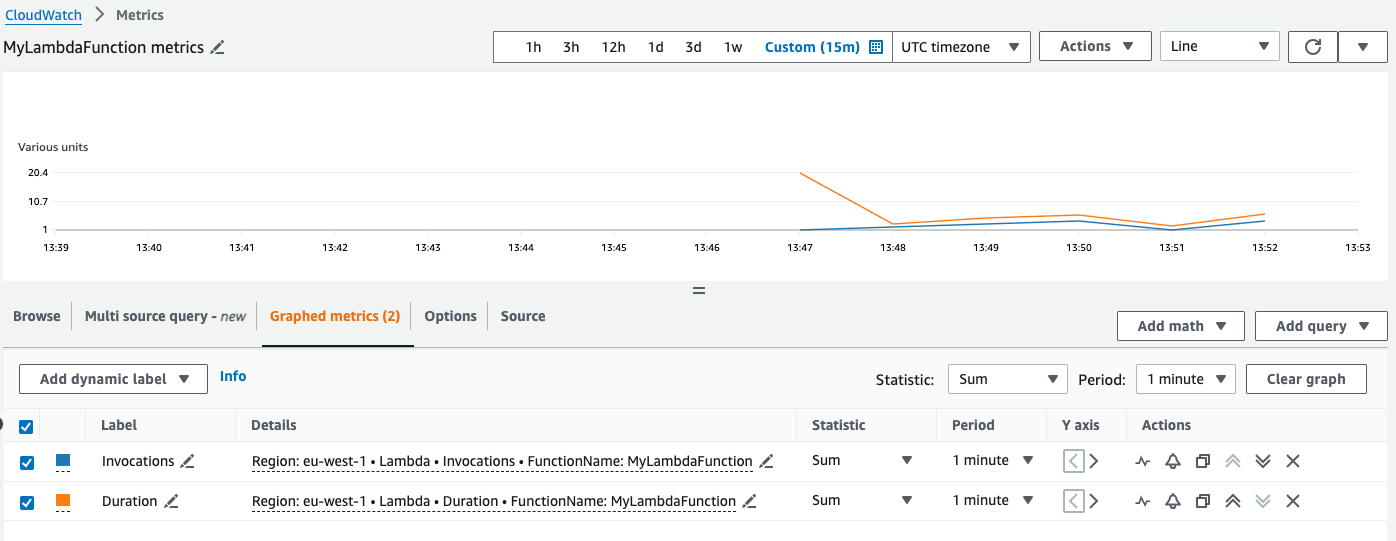
Using the console, we can view historical graphs of our metrics, as shown below:

This graph shows the metrics for a lambda function MyLambdaFunction, specifically how many times the function has run (invocations), along with how long the lambda takes to run (duration).
CloudWatch Alarms
Once we’re aware of the metrics available for a particular resource, we can use them to set alarms. For example, we might want to be notified if the CPU usage on one of our EC2 instances went above 75% or if one of our lambdas was being throttled. Alarms have associated actions that are triggered when a metric goes into an alarm state or when it returns to normal, and we can, for example, send a message to a SNS topic, trigger a lambda to resolve something, or if we’re using an EC2 metric, perform EC2 actions such as stopping or rebooting the instance.
If we’re graphing a metric through CloudWatch, we’ll have the option to create an alarm directly or create one from the console. When we create the alarm, we’ll be asked for the following:
- A name and description
- Which namespace we are interested in, such as
EC2orLambda - Which metrics do we want to monitor, i.e., CPU utilisation, throttle, etc.?
- What is the dimension for the metric, i.e., which instance, DynamoDB table, function name, etc.?
- How we’ll measure the metric, such as using averages, sums, or minimum or maximum values. The AWS documentation for each service will explain the best statistics to use; for example, the Lambda documentation can be found here.
- What period do we want to monitor, and how many anomalies do we need to trigger the alarm?
- What the threshold is for triggering the alarm—this is a value and condition such as
GreaterThanThresholdorLessThanThreshold. - What actions should be triggered when an alarm occurs or when it returns to its normal state?
Calculated alarms using metric math.
Generally, we want to alarm on the absolute value of a metric, for example, when CPU utilisation exceeds a certain amount or if a lambda is being throttled. However, sometimes we’ll be more interested in a relative value—maybe the percentage of runs that generate errors. A single error is important if a lambda runs once or twice, but much less so if the lambda runs thousands of times a day.
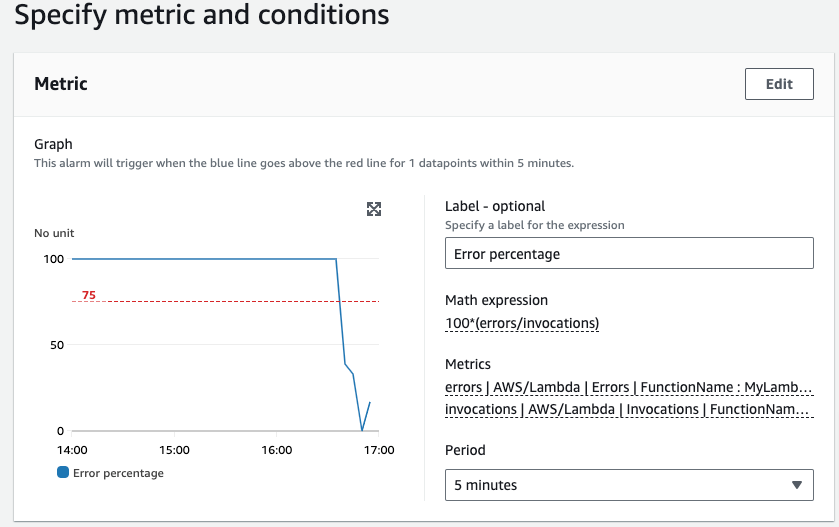
Where this isn’t available as a metric, we can often calculate them using what is known as metric math. So for example, with the example above, we can calculate the number of errors as a percentage of invocations
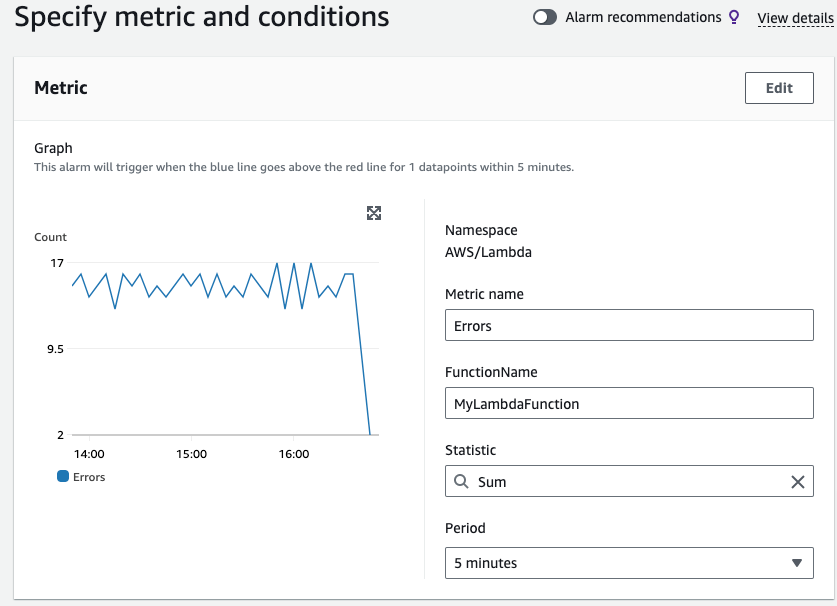
Rather than looking at the absolute value of the Error metric as in

we can use expressions to calculate a value

Deploying Alarms via Infrastructure as Code.
Of course, best practices today dictate that we should be deploying our infrastructure as code, using tools such as CloudFormation or Terraform.
Note: The examples below are not full deployments, they only show how to create alarms.
Deploying an alarm with absolute values using CloudFormation
The yaml CloudFormation below will deploy an alarm which will trigger when a lambda is throttled.
In this case, the definition is reasonably simple as we are looking at a single metric, in this case the Throttles metric in the AWS/Lambda namespace.
It depends on the following references
| Variable Name | Description |
|---|---|
LambdaFunctionName |
The name of the deployed Lambda |
LambdaThrottlePeriod |
What period should we use when assessing if a throttle has occurred |
LambdaThrottleThreshold |
How many throttles do we need to see before triggering the alarm |
aws_sns_topic.ErrorAlarmTopic |
The SNS Topic to send alarms to |
  rLambdaThrottledAlarm:
    Type: AWS::CloudWatch::Alarm
    Properties:
      AlarmName: !Sub "lambda-function-${pLambdaFunctionName}-throttled"
      AlarmDescription: !Sub "lambda-function-${pLambdaFunctionName} is throttled"
      MetricName: Throttles
      Namespace: AWS/Lambda
      Dimensions:
        - Name: FunctionName
          Value: !Ref pLambdaFunctionName
      Period: !Ref pLambdaThrottlePeriod
      Statistic: Sum
      EvaluationPeriods: 1
      Threshold: !Ref pLambdaThrottleThreshold
      ComparisonOperator: GreaterThanThreshold
      TreatMissingData: ignore
      AlarmActions:
        - !Ref rAlarmTopic
      OKActions:
        - !Ref rAlarmTopic
Deploying an alarm with absolute values using Terraform
The Terraform below will deploy an alarm which will trigger when a lambda is throttled. It depends on the following variables and resources:
| Variable Name | Description |
|---|---|
LambdaFunctionName |
The name of the deployed Lambda |
LambdaThrottlePeriod |
What period should we use when assessing if a throttle has occurred |
LambdaThrottleThreshold |
How many throttles do we need to see before triggering the alarm |
AlarmTopic |
The SNS Topic to send alarms to |
resource "aws_cloudwatch_metric_alarm" "LambdaThrottledAlarm" {
  alarm_name          = "lambda-function-${var.LambdaFunctionName}-throttled"
  alarm_description   = "lambda-function-${var.LambdaFunctionName} is throttled"
  comparison_operator = "GreaterThanThreshold"
  evaluation_periods  = "1"
  metric_name         = "Throttles"
  namespace           = "AWS/Lambda"
  period              = var.LambdaThrottlePeriod
  treat_missing_data  = "ignore"
  statistic           = "Sum"
  threshold           = var.LambdaThrottleThreshold
  alarm_actions       = [aws_sns_topic.AlarmTopic.arn]
  ok_actions          = [aws_sns_topic.AlarmTopic.arn]

  dimensions = {
    FunctionName = var.pLambdaFunctionName
  }
}
Deploying an alarm with calculated values using CloudFormation
This time, the template is more complex. We cannot simply add the metrics to be measured, but we also need to include the expression that will be calculated and use that as the trigger for the alarm.
Note: We use two intermediate metrics, errors and invocations which we then reference in the expression. Both of the intermediate metrics are tagged with ReturnData: false to indicate they are intermediates.
  rMyLambdaErrorsAlarm:
    Type: AWS::CloudWatch::Alarm
    Properties:
      AlarmName: !Sub "lambda-function-${pLambdaFunctionName}-errors"
      AlarmDescription: !Sub "lambda-function-${pLambdaFunctionName} errors exceed ${pLambdaErrorThreshold} %"
      Metrics:
        - Id: error_percentage
          Label: Errors
          Expression: (errors/invocations)*100
        - Id: errors
          Label: input
          ReturnData: false
          MetricStat:
            Metric:
              Namespace: AWS/Lambda
              MetricName: Errors
              Dimensions:
                - Name: FunctionName
                  Value: !Ref pLambdaFunctionName
            Period: !Ref pLambdaErrorPeriod
            Stat: Sum
            Unit: Count
        - Id: invocations
          Label: input
          ReturnData: false
          MetricStat:
            Metric:
              Namespace: AWS/Lambda
              MetricName: Invocations
              Dimensions:
                - Name: FunctionName
                  Value: !Ref pLambdaFunctionName
            Period: !Ref pLambdaErrorPeriod
            Stat: Sum
            Unit: Count
      EvaluationPeriods: 1
      Threshold: !Ref pLambdaErrorThreshold
      ComparisonOperator: GreaterThanThreshold
      TreatMissingData: ignore
      AlarmActions:
        - !Ref rErrorAlarmTopic
      OKActions:
        - !Ref rErrorAlarmTopic
Deploying an alarm with calculated values using Terraform
Again, this is more complex than the Terraform used to deploy the alarm based on an absolute value, because again we need to use an expression to calculate the value for the alarm to monitor.
resource "aws_cloudwatch_metric_alarm" "MyLambdaErrorsAlarm" {
  alarm_name          = "lambda-function-${var.LambdaFunctionName}-errors"
  alarm_description   = "lambda-function-${var.LambdaFunctionName} errors exceed ${var.LambdaErrorThreshold} %"
  comparison_operator = "GreaterThanThreshold"
  evaluation_periods  = "1"
  threshold           = var.LambdaErrorThreshold
  treat_missing_data  = "ignore"
  alarm_actions       = [aws_sns_topic.AlarmTopic.arn]
  ok_actions          = [aws_sns_topic.AlarmTopic.arn]

  metric_query {
    id          = "error_percentage"
    expression  = "(errors/invocations)*100"
    label       = "Errors"
    return_data = true
  }

  metric_query {
    id = "errors"
    metric {
      metric_name = "Errors"
      namespace   = "AWS/Lambda"
      period      = var.LambdaErrorPeriod
      stat        = "Sum"
      unit        = "Count"

      dimensions = {
        FunctionName = var.LambdaFunctionName
      }
    }
    return_data = false
  }

  metric_query {
    id = "invocations"
    metric {
      metric_name = "Invocations"
      namespace   = "AWS/Lambda"
      period      = var.LambdaErrorPeriod
      stat        = "Sum"
      unit        = "Count"

      dimensions = {
        FunctionName = var.LambdaFunctionName
      }
    }
    return_data = false
  }
}
Metric and alarm pricing.
In this post, we’re using standard metrics provided by AWS which are provided by AWS without charge.
Alarms are priced per metric, with each metric monitored costing $0.10 per month (depending on region). So our initial, absolute alarm would cost $0.10 per month as it monitors a single metric, whilst the calculated alarm would cost $0.20 per month. There is a free tier where the first 10 alarms per month are free.
- This article was originally published on the AWS Community Site at https://dev.to/aws-builders/generating-cloudwatch-alarms-using-metric-math-via-cloudformation-and-terraform-60l

